Margin Trading

What is Margin in Trading?

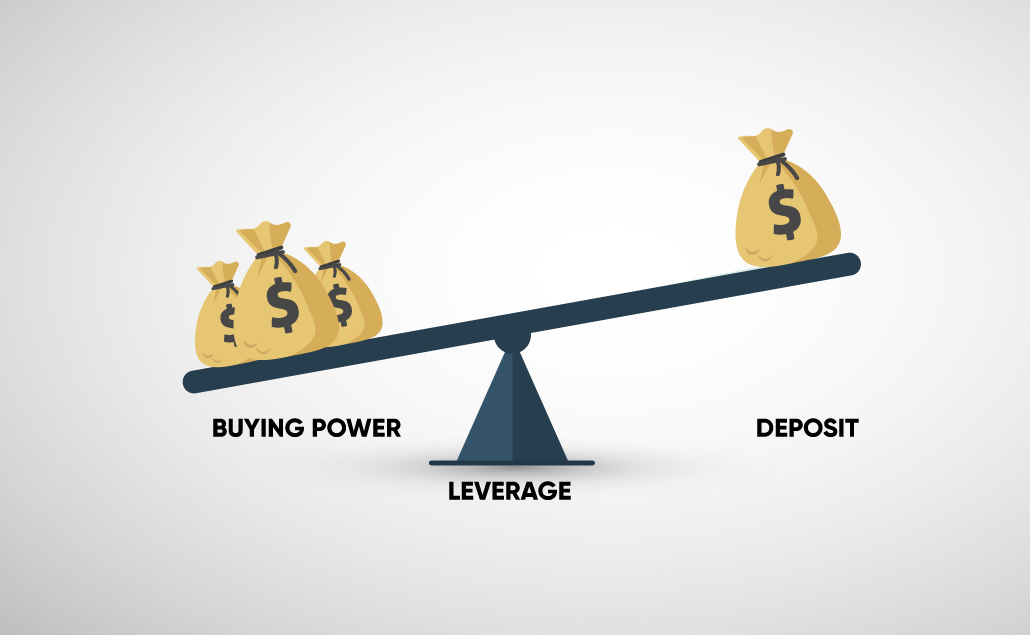
Margin in trading refers to the practice of utilizing leverage to increase the potential returns from the purchase and sale of securities. In simple terms, it is the borrowing of money from a broker to purchase securities. This practice can help traders increase their buying power, allowing them to make bigger trades than what their actual funds would allow. 

In this article, we’ll take a closer look at what margin in trading is and how it works.

What does Buying on Margin Mean?

Buying on margin is a type of investment strategy that involves purchasing an asset, such as stocks, using borrowed funds provided by a broker. The borrower receives a loan from the broker, typically in the form of cash, and uses it to purchase the asset. The borrower will then pay back the loan plus interest, using the proceeds from any future sale of the asset. 

This type of investment technique is generally considered to be riskier than investing with cash.

How Do You Buy CFDs on Margin?

CFDs are derivatives products that are traded on margin. They allow traders to open a position based on the exact amount of money a trader is willing to risk (the margin). 

To buy CFDs on margin, first, you need to open an account with a CFD broker. Next, you’ll need to select the CFD you wish to trade, and then decide how much leverage you would like to use. Different brokers allow for different amounts of leverage, so it’s important to check their leverage policy before deciding how much risk you would like to take. With a CFD broker, you can then place an order and the broker will execute the purchase at the market price. 

Once the trade is complete, your account will be credited with the difference between the purchase and sell prices.

What is a Margin Call?

A margin call is a broker’s demand for an investor who has purchased securities on margin to deposit additional funds in order to bring the margin account up to the minimum maintenance margin requirement. It is a warning that the investor’s equity in the account is falling below a certain level, and if it continues to decline, the broker may need to liquidate the investor’s holdings to cover the margin loan.

What Is Free Margin?

Free margin is the amount of money in your trading account that is available to open new positions. It is the difference between the equity in your trading account and the margin that is used to maintain open positions. It can be used as a tool to measure the risk level of a position.

The Risks and Benefits of Buying on Margin

The risks of buying on margin are as follows:

  • Margin Calls: A margin call occurs when the value of a margin account falls below the margin maintenance requirement set by the broker. If this happens, the trader must deposit more money or securities in order to meet this requirement or face the risk of their position being liquidated.
  • Unforeseen Price Action: Margin trading carries the risk of unforeseen price action that can cause higher losses than what the trader initially predicted. This can occur if the trader’s position moves against them and they are unable to close it in time before a large decrease in the market value.
  • Liquidation Risk: If a trader’s account runs out of money or the market prices move against the trader, their positions may be liquidated. This means their broker will close out the trades and the trader is liable for any losses and fees associated with the liquidation
  • Leverage Risk: Leverage can be both a benefit and a risk. When the market moves in a favorable direction, leveraging can allow a trader to make higher profits than if they simply invested the same amount of money without leverage. On the other hand, when the market moves in an unfavorable direction, leveraging can magnify losses and leave the trader in a negative position

While the benefits are:

  • Increased Potential Profits: By leveraging their capital, margin traders can increase their potential profits. Leveraging allows traders to invest more money than they normally would be able to while using only their own capital. This can end up increasing their profits significantly
  • Lower Transaction Costs: Since the money used to make trades is effectively borrowed, the transaction costs are generally much lower on a margin account than on a regular trading account. This means traders can make more transactions with less capital, potentially increasing their profit
  • Easy Access to Capital: Margin accounts provide traders with easy access to capital, which can be used to fund more trades or to increase their trading size on existing positions. This can be beneficial to traders who don’t have a lot of capital to start with, but still want to trade.
Stop Loss Order Forex

What Is a Stop Loss Order?

A stop-loss order is an order to buy or sell a security when it reaches a certain price point. A stop-loss order helps investors to protect their capital and limit their losses, while also allowing them to remain in trade without having to monitor the market throughout the day. When a stop-loss is triggered, the security is sold automatically and the investor’s losses are limited.

Stop-loss orders can be used as part of a wider strategy. By setting multiple stop-loss orders, investors can ensure that they are exiting trades at pre-determined price points and reducing their potential losses. 

Additionally, investors can use stop-loss orders as part of a trend-following strategy, where trades are closed out at the end of a trend.

How Does a Stop Loss Order Work?

The stop-loss order helps traders and investors manage risk in their portfolios. When the security reaches the specified price, the broker will close the trade, realizing a loss. This type of order is especially useful when trading volatile markets where prices can drop suddenly and unexpectedly. 

Stop-loss orders allow traders to limit the amount of risk they are willing to take on, allowing them to sleep better at night. Stop-loss orders are a common risk-management tool used by traders and investors alike.

Keep learning more with Eurotrader

Profit and loss ratios are very important in trading. You can access the link below, which we have prepared for you, and where you can make profit and loss calculations down to the most detailed detail!

Eurotrader Education Hub

Why Do You Use a Stop Loss Order?

When it comes to investing, risk management is a key part of preserving and growing wealth. One way that investors guard against potential losses is with a Stop Loss order. 

Stop Loss orders are designed to limit any losses on a particular investment by automatically selling the asset, such as a stock, at a certain price. This predetermined price point is set based on the investor’s risk tolerance as well as their desired level of return. By using a Stop Loss order, investors are protected from excessively large losses due to market downturns or other unpredictable events. 

The order also takes a lot of the emotion out of trading, as the investor does not have to manually sell the stock – it is done automatically. Therefore, Stop Loss orders can prove to be a valuable tool for investors who are looking to limit their losses and achieve their desired return on investment.

How Long Can Your Stop Loss Orders Last?

Stop loss orders are instructions placed with a broker to sell a security when it reaches a certain price point. This way, if the security plummets, the investor doesn’t take a huge hit. Stop loss orders can be set to last for as long as the investor wants; it can be a day, a week, a month, or even a year. However, due to market fluctuations, the order may be triggered before the time is up. It is important to monitor stop-loss orders and adjust them accordingly if they don’t match the investor’s current goals. 

Also, investors can choose to close out their order at any time if they don’t want it to run any longer. The investor can also set price adjustments on a stop-loss order should the market move in their favor. All in all, it is important to consider how long a stop-loss order should be set to ensure it is serving its purpose in the portfolio.

At Eurotrader, we’re passionate about helping our members become successful traders. We provide an array of resources and support that make trading easier and more profitable. With our guidance, you can increase your return on investment and optimize your trading strategies. Join the Eurotrader community and start trading today to take your financial goals to the next level.

Disclaimer

Eurotrader doesn’t represent that the material provided here is accurate, current, or complete, and therefore shouldn’t be relied upon as such. The information provided here, whether from a third party or not, isn’t to be considered as a recommendation; or an offer to buy or sell; or the solicitation of an offer to buy or sell any security, financial product, or instrument; or to participate in any particular trading strategy. We advise any readers of this content to seek their advice.

Fundamental Analysis

What is Fundamental Analysis?

Fundamental Analysis is an investment strategy used to assess companies and industries by analyzing their financial data, including income statements and balance sheets. This technique examines the intrinsic value of an investment item by taking a close look at its financials, such as performance, strengths, and weaknesses. 

The main goal of this approach is to determine whether or not a given stock is undervalued or overvalued by the market. To do this, investors use financial reports and financial ratios to compare companies and identify the best investment opportunities.

By assessing the current financial state of a company, fundamental analysis can help investors discover potential opportunities that may have gone unnoticed. For instance, an analysis may reveal that a given stock is trading at a lower than its intrinsic value, meaning the stock could be a good buy. Furthermore, this technique can also be used to identify which stocks to sell if their market prices are higher than the intrinsic value.

What is an Example of Fundamental Analysis?

A good example is when analyzing Walmart (NYSE: WMT), an investor would look at the company’s financial statements, including the balance sheet, income statement, and cash flow statement. By studying the company’s financial statements, the investor can get an idea of the company’s financial performance and current condition. 

Additionally, an investor can look at the company’s financial ratios, such as the price-earnings ratio or the debt-to-equity ratio, to get a better understanding of the company’s fundamentals. Furthermore, the investor can analyze the company’s competitive positioning, management team, and business model to gain insight into the company’s potential prospects. 

Lastly, analyzing elements such as the company’s dividend history and stock price performance can also be useful for fundamental analysis. 

Keep learning more with Eurotrader

While we have covered everything about fundamental Analysis in this article, there is still a lot to learn about trading! Click on the link below to watch our videos where you can learn all the details about trading!

Trading Video Courses

What are the Advantages And Disadvantages of Fundamental Analysis?

Fundamental analysis is a method of evaluating a stock or other asset by analyzing its intrinsic value and underlying economic, financial, and business fundamentals. While it can be a helpful tool in making investment decisions, it also has both advantages and disadvantages that must be considered.

Advantages of Fundamental Analysis

  • The fundamental analysis offers a long-term view of investing, by looking at economic, financial, and business conditions over time.
  • It allows investors to understand the company’s overall financial health, and make informed decisions about investments.
  • For example, fundamental analysis can help identify companies with strong performance, or stocks that are undervalued.
  • It can also be used to forecast potential earnings and determine the fair value of a company based on its assets, liabilities, and prospects.

Disadvantages of Fundamental Analysis

  • Fundamental analysis is a lengthy and complex process that requires extensive research and analysis.
  • It can also be difficult to estimate the prospects of a company, so the results of the fundamental analysis should be taken with a grain of salt.
  • Fundamental analysis can also be subjective, as the interpretation of economic, financial, and business factors is subject to individual opinion and bias.
  • Additionally, the results of fundamental analysis can be quickly outdated due to changes 

What are Quantitative and Qualitative Fundamental Analyses?

Quantitative and fundamental analysis are two widely used methods of making investment decisions in the stock market. Quantitative analysis is a form of analysis where investors use data on stocks such as pricing, volume, and financial metrics to make decisions. Some of the most common quantitative metrics used in the fundamental analysis include the price-to-earnings (P/E) ratio, enterprise value to EBITDA, and revenue growth rate.

Qualitative fundamental analysis is a method of analysis that focuses on the qualitative aspects of a business such as its product offerings, leadership, competitive landscape, and prospects. Qualitative features such as management capabilities, company culture, and overall strategy are used in this type of analysis.

At Eurotrader, we’re passionate about helping our members become successful traders. We provide an array of resources and support that make trading easier and more profitable. With our guidance, you can increase your return on investment and optimize your trading strategies. Join the Eurotrader community and start trading today to take your financial goals to the next level.

Disclaimer

Eurotrader doesn’t represent that the material provided here is accurate, current, or complete, and therefore shouldn’t be relied upon as such. The information provided here, whether from a third party or not, isn’t to be considered as a recommendation; or an offer to buy or sell; or the solicitation of an offer to buy or sell any security, financial product, or instrument; or to participate in any particular trading strategy. We advise any readers of this content to seek their advice.

spread in forex

What is Spread in Forex?

The spread is the difference between the buying price (bid) and the selling price (ask) of a currency pair. It is the cost of transacting a trade. The spread changes continuously depending on liquidity and market conditions and can range from a fraction of a pip to several pips. By understanding the spread, traders can capitalize on opportunities when they arise and know when the market is not worth entering.

It is important to understand exactly how the spread, a fundamental factor in the foreign exchange market, works. Spreads will vary depending on liquidity, volatility, and other market conditions. Generally, the more liquid a currency pair is, the narrower the spread will be, which means that the price difference between the bid and ask is smaller. Similarly, when volatility or market conditions pick up, spreads will generally widen, meaning the cost of trading goes up.

By understanding the spread, traders can identify when certain price movements or trends in the currency pair may be beneficial or costly. Knowing how much you can expect to pay in spread fees will help you determine which trades are the most beneficial to enter. Additionally, with the right strategies in place, traders can capitalize on opportunities when spreads narrow and avoid trades when spreads widen.

How to Calculate the Spread in Forex?

Spread in the Forex is typically measured in pips (1 pip = 0.0001) and is the broker’s commission for executing the trade. The formula for calculating the spread is:

Spread = Ask Price – Bid Price

For example, if the EUR/USD bid price is 1.3000 and the ask price is 1.3003, then the spread would be 3 pips (1.3003 – 1.3000 = 0.0003 = 3 pips).

What Determines the Spread in Forex?

The spread is determined by a variety of factors, but primarily by supply and demand. When a currency pair is in high demand, meaning many traders want to buy it, the bid price will be higher than the ask price and the spread will be larger. When demand is lower, the spread will be smaller. Spreads can also be affected by economic events, such as economic data releases, news events, and central bank decisions. Other factors affecting the spread include the liquidity of a currency pair, trading costs, and the broker’s markup. In some cases, a broker may add additional costs to the spread to make a profit. 

At Eurotrader, we’re passionate about helping our members become successful traders. We provide an array of resources and support that make trading easier and more profitable. With our guidance, you can increase your return on investment and optimize your trading strategies. Join the Eurotrader community and start trading today to take your financial goals to the next level. 

Disclaimer

Eurotrader doesn’t represent that the material provided here is accurate, current, or complete, and therefore shouldn’t be relied upon as such. The information provided here, whether from a third party or not, isn’t to be considered as a recommendation; or an offer to buy or sell; or the solicitation of an offer to buy or sell any security, financial product, or instrument; or to participate in any particular trading strategy. We advise any readers of this content to seek their advice.

Leverage Forex

What is Leverage in Forex?

Leverage in forex is a powerful tool that can allow traders to magnify their potential profits and also their losses. Leverage is a feature offered by brokers and it gives traders access to larger capital to trade on financial markets than their account balance would otherwise allow them to. 

Leverage allows a trader to open a large position with a relatively small investment. For example, if a trader wants to open a position with currency worth 10,000 dollars, a broker may offer them the leverage of 200:1, meaning that the trader only needs a balance of 50 dollars in their account to open the position. Another example, to control a 100,000 dollars position, the broker could set aside 1,000 dollars from the client’s account (margin). The leverage, which is expressed in ratios, is now 100:1. This can be beneficial to traders when markets are on their side and it can give them the potential to make very large returns on modest investments.  

However, leverage can be a double-edged sword, as it can also magnify losses if the market moves against a trader. For example, if a trader opens the above position and the market moves against them, then potential losses could be multiplied by the leverage and a position worth 10,000 may result in an account balance of zero. Therefore, it is important to be aware of the risks associated with leverage and trade responsibly. 

What are the Types of Leverage Ratios?

The most common type of leverage ratio used by forex traders is the margin ratio, which is generally expressed as 1:1, 2:1, 5:1, 10:1, 20:1, 50:1, 100:1 or 500:1. The margin ratio indicates the financial investment the trader must have to open a position. For example, a margin ratio of 1:1 means that a trader must have the same amount of capital in their account as the position requires.

A margin ratio of 50:1 means that the trader only needs 2% of the amount required in their account. Other types of leverage ratios include Leveraged accounts and CFDs, which are geared toward investors who are comfortable with higher risks. Leveraged accounts allow traders to access higher levels of leverage with smaller investments, while CFDs enable traders to benefit from the movement of financial markets without having to physically own the instrument. 

The Risks of Leverage in Forex

Leverage increases potential gains but also potential losses. For example, a trader utilizing a 50:1 leverage, meaning they can control up to 50 times the amount of money they have, can make a much larger profit or loss compared to a regular trader. This leverage means that if the market moves against the trader, they can easily find themselves underwater, risking their entire trading account. Conversely, if the market moves in the trader’s favor, their profits can multiply quickly.

It’s important to remember that leverage also increases the risk in trading. If a trader uses a 50:1 leverage and the market moves against them by 1%, it will result in a 50% loss of their account. Such losses can sometimes be devastating and can happen much faster than most people expect. Leverage should only be used by experienced traders who understand the risks and can manage potential losses responsibly and safely.

At Eurotrader, we’re passionate about helping our members become successful traders. We provide an array of resources and support that make trading easier and more profitable. With our guidance, you can increase your return on investment and optimize your trading strategies. Join the Eurotrader community and start trading today to take your financial goals to the next level. 

Disclaimer

Eurotrader doesn’t represent that the material provided here is accurate, current, or complete, and therefore shouldn’t be relied upon as such. The information provided here, whether from a third party or not, isn’t to be considered as a recommendation; or an offer to buy or sell; or the solicitation of an offer to buy or sell any security, financial product, or instrument; or to participate in any particular trading strategy. We advise any readers of this content to seek their advice.

What is a Pip in Forex?

What is a Pip in Forex?

A pip in Forex is a unit of measurement used in determining the fluctuations in the exchange rates of different currencies. It stands for “percentage in point” and is the smallest incremental move that a currency pair can make on the market. A pip is usually equal to 1/100th of 1% of the pair’s current value. 

In Forex, traders watch the pip movements of a currency pair to establish trends, gauge potential profit and loss opportunities, and determine the overall performance of the currencies being traded. Pips are also used in calculating various features of a currency pair’s performance, such as overall gain or loss and margin requirements. 

Forex traders buy and sell a currency whose value is expressed in relation to another currency. Quotes for these forex pairs appear as bid and ask spreads that are accurate to four decimal places.

The value of a pip can also vary depending on what currency pair is being traded. Most pairs go out to four decimal places, but there are some exceptions like Japanese yen pairs which go out only to two decimal places. For example, for EUR/USD, it is 0.0001, and for USD/JPY, it is 0.01. In this respect, one pip in EUR/USD is worth less than one pip in USD/JPY. 

Ultimately, keeping track of the pip movements of currency pairs is integral for traders to make successful trades in the Forex market.

Pip Example

For example, if the EUR/USD currency pair is trading at 1.1895 and moves to 1.1896, it has increased by one pip. The value of a pip can vary and is calculated by the differences in the exchange rates between the two currencies in the pair. In the EUR/USD example, a one-pip move would be 0.0001, or 0.01%. 

If the same currency pair changed from 1.1895 to 1.1860, this would be a decrease of 35 pips. Because each currency is quoted in a different amount against the other and pips can vary, the value of a pip can be different from pair to pair. For example, a one-pip change in the USD/JPY pair would be significantly larger than a one-pip move in the EUR/USD pair. 

Therefore, any change in value for an individual currency pair must be measured in terms of pips since this is the smallest amount of change to be measured. 

How does Pip work?

A pip works by measuring the smallest amount of change in the value of a currency pair. As already mentioned, a pip represents the fourth decimal place in a currency pair, except in the case of the Japanese yen, when the second decimal place is used. Pips are used to calculate profits and losses when trading in the forex market.

How to Calculate the Value of a Pip?

The value of a pip can be calculated for any pair by multiplying the size of the trade by the size of the pip, in pips. For example, if a trade of 10,000 units was placed on the EUR/USD pair at a rate of 1.1000, the value of a pip would be calculated as follows: 10,000 * 0.0001 = 1 pip. This means that for every 0.0001 move in the exchange rate of the pair, the trade’s profit or loss will increase or decrease by 10 units of the currency in which the trader trades. 

At Eurotrader, we’re passionate about helping our members become successful traders. We provide an array of resources and support that make trading easier and more profitable. With our guidance, you can increase your return on investment and optimize your trading strategies.

Check out our Pip Calulator.

Join the Eurotrader community and start trading today to take your financial goals to the next level.

Disclaimer

Eurotrader doesn’t represent that the material provided here is accurate, current, or complete, and therefore shouldn’t be relied upon as such. The information provided here, whether from a third party or not, isn’t to be considered as a recommendation; or an offer to buy or sell; or the solicitation of an offer to buy or sell any security, financial product, or instrument; or to participate in any particular trading strategy. We advise any readers of this content to seek their own advice.

What is CFD Trading?

What is CFD Trading?

CFD trading (Contracts for Difference) is a form of derivative trading that allows investors to speculate on the price movements of securities, commodities, and foreign currencies without owning the underlying asset. CFD trading is an attractive form of trading for investors due to its many advantages over traditional forms of investing, such as leveraged trading, low cost of entry, and no need for extensive market knowledge.

How do CFDs work?

Traders open a CFD position and take advantage of price movements in the underlying asset, either up or down, but without taking ownership of the asset. Instead, when opening a CFD position, traders open a contract with a broker and agree to pay or receive the difference between the current and opening price of the asset when the trade is closed.

What are Leverage and Margin in CFD Trading?

Leverage and margin are two important concepts to understand in CFD trading. Leverage is the amount of money borrowed from the broker to finance a trade. For example, if you wanted to open a trade for $100 with 10:1 leverage, you would need to put up only $10 of your funds. Margin, on the other hand, is the difference in the price of the asset at the time of the trade and the time it was opened. For example, if you opened a trade for a CFD with a $100 value, and the asset opened at $90, the margin would be $10.

The way that leverage and margin differ in CFD trading compared to their original meanings is that they are much more greatly leveraged than in normal trading. For example, when trading stocks, the leverage is usually limited to 1:5 or 1:10, however, when trading CFDs, the leverage can often be as high as 1:400 or even 1:500, depending on the broker. This can allow traders to invest much more money than they initially had, making their potential profits much larger. The margin also differs in CFD trading, as it is not the difference between the price of the asset when the trade was opened and when it was closed, as is typically the case with stocks, but rather the difference between the entry price and the current price of the asset at any given time.

What is the Cost of CFD Trading?

The cost of CFD trading varies widely, depending on the individual broker and their offerings. Typically, the most common fees associated with CFD trading are the broker commission or spread. Broker commissions are the user’s cost to the broker for conducting their trades. Spreads are the difference between the bid and ask prices for a given instrument.

Aside from the broker commission or spread, CFD traders may also incur some additional costs such as:

  • Trading platform fees
  • Exchange and clearing fees
  • Clearinghouse fees
  • Margin fees
  • Regulatory fees

Depending on the type of instruments traded, these fees can add up quickly and can affect the overall profitability of a trader’s CFD account. It is important for CFD traders to fully understand the costs associated with their trading activities and to factor those costs into their trading strategy.

What are the Advantages & Disadvantages of CFD Trading?

CFD trading can be an advantageous way to capitalize on the movements of underlying assets, allowing traders to gain exposure to markets they would otherwise not be able to access. However, it also comes with certain risks and disadvantages that may not be suitable for all traders.

Advantages

  1. CFD trading can be cheaper than other types of trading since CFDs usually have lower commissions and transaction fees.
  2. CFDs allow traders to go short as well as long, meaning that traders can still make profits even when the markets are falling.
  3. Leverage can be used when trading CFDs, enabling traders to make larger trades with limited capital.
  4. CFDs can provide access to a wider range of markets, including stocks, commodities, indices, and currencies.
  5. CFDs tend to have shorter settlement periods than other types of trading, offering more flexibility for the trader.

Disadvantages

  1. Leverage can also lead to heightened losses, with traders running the risk of losing more than their initial deposits in some cases.
  2. CFDs do not provide physical ownership of the asset, so they lack some of the tax benefits associated with ownership.
  3. CFDs may not be suitable for traders who are looking for dividend payouts.
  4. CFDs may be more expensive than other types of trading when it comes to widening spreads and payment of overnight fees.

What is the Difference Between CFD and Investment?

The biggest difference between CFD and investment is that CFD allows you to trade in a wide range of markets without actually owning the underlying asset. With CFD, you can speculate on stocks, indices, commodities, and foreign currencies. On the other hand, investments allow you to own an underlying asset and can be held for long periods, as you can benefit from various market movements. Investing is generally better suited for long-term investing goals, while CFD trading is more suitable for short-term goals. With CFD, you are exposed to the highest level of risk, and losses can be much higher compared to investments. CFD also requires greater investment knowledge, so individuals need to understand the key risks before investing. Ultimately, the best decision will depend on the individual’s goals, risk appetite, and financial situation.

Disclaimer

Eurotrader doesn’t represent that the material provided here is accurate, current, or complete, and therefore shouldn’t be relied upon as such. The information provided here, whether from a third party or not, isn’t to be considered as a recommendation; or an offer to buy or sell; or the solicitation of an offer to buy or sell any security, financial product, or instrument; or to participate in any particular trading strategy. We advise any readers of this content to seek their advice.

Psychology of Trading

Introduction 

To be successful in trading, you need to know more than just the markets; you need to know yourself. The mental side of trading is just as important as the technical know-how, but it gets less attention. In order to help traders incorporate psychological awareness into their trading tactics, this article explores the most important psychological phenomena that traders face and provides practical advice on how to do so. 

Grasping Essential Ideas in Psychology 

The mental and financial tolls of trading are substantial. If you want to become a psychological trading master, you need to grasp these ideas. 

Confirmation Bias 

Our brains have a bias called confirmation bias, and it manifests itself when we look for, understand, and remember things in a way that backs up our previous ideas and opinions. As a trader, this involves giving more weight to data that backs up your earlier investment judgments and giving less weight to data that contradicts them. For example, you may lose a lot of money if you keep onto a stock that isn’t doing well just because you’re looking for evidence to support your original decision. 

Mental Accounting 

The term “mental accounting” describes the way in which people’s subjective evaluations of monetary worth vary. Because of this, traders run the danger of making foolish and damaging financial decisions, such as risking more of their gains (“house money”) than their initial investment. Making better, more informed decisions on risk management is possible after one is aware of this tendency. 

Overconfidence Bias 

When traders exaggerate their capacity to foretell market moves, they are engaging in overconfidence. Underestimating risks and engaging in excessive trading are possible outcomes. A trader may mistakenly assume they are invincible after a string of profitable trades and overtrade as a result. 

Loss Aversion 

The propensity to value avoiding losses over gaining similar gains is known as loss aversion. This frequently shows itself in trading as trying to “lock in gains” by selling winning positions too soon or holding onto losing positions for too long in the hopes that they would recover. In order to make more rational trading decisions, it is critical to identify this bias. 

Methods to Manage Your Mindset When Trading 

Creating a disciplined trading strategy relies on controlling your psychological tendencies. 

Defining Objectives and Boundaries 

It is critical to set firm stop-loss and take-profit thresholds in addition to clear, attainable financial objectives. That way, you can keep your cool under pressure and avoid making rash decisions based on your emotions. 

Formulating a Strategy for Trading 

If you want to avoid making emotional, hasty decisions in trading, make sure you have a plan. Maintaining concentration and self-control requires constant adherence to the strategy. 

Self-Control and Being Present 

Meditation and mindfulness, which are methods for controlling one’s emotions, can have profound effects. By incorporating these strategies into your trading routine, you can keep your emotions and stress at bay and make more rational trading judgments. 

Ongoing Education and Self-Reflection 

Keeping a trading notebook is a great way to learn from your mistakes and reflect on your progress. If you want to know how your psychological biases affect your trading decisions, it helps to review your wins and losses on a regular basis. 

Spreading Your Bets and Keeping Your Risks Low 

One way to lessen the blow of possible losses emotionally and financially is to diversify your investments. In addition to being a sound financial plan, effective risk management also serves as a psychological tool for preserving emotional stability. 

Conclusion 

A complicated and frequently overlooked facet of the financial world is the psychology of trading. Make better, more rational trading judgments by learning about and controlling your psychological biases and incorporating emotional discipline into your trading technique. Keep in mind that in the trading business, your intellect is more valuable than whatever portfolio you own. 

Trading tips eurotrader

Understanding Inflation: From Basics to Exchange Rates

What is Inflation?

Inflation is essentially the rate at which the general level of prices for goods and services rises. Imagine you could buy a loaf of bread for $1 last year, but this year, the same bread costs $1.10. The increase in price is a simple example of inflation. In other words, as inflation rises, every dollar you own buys a slightly smaller percentage of a good or service.

Inflation is Additive

  • Cumulative Nature: Inflation tends to be a cumulative process. This means that the increase in prices generally adds up over time, rather than resetting or reverting back to previous levels. For example, if the inflation rate is 2% per year, a product costing $100 this year would cost $102 the next year, and so on, each year adding on top of the last.
  • Compound Effect: Just like compound interest, inflation compounds over time. This means that the price increases build upon each other. In a long-term perspective, this effect can be substantial, causing prices to increase significantly over decades.

How Does Inflation Affect Consumers?

For consumers, inflation means the purchasing power of their money decreases. If your income doesn’t increase at the same rate as inflation, you’ll find that you can afford less than before. This situation can strain budgets, especially for essentials like food, housing, and healthcare. Inflation also affects savings; money saved today might be worth less in the future if inflation is high.

Central Banks and Inflation

Central banks, like the Federal Reserve in the U.S. or the European Central Bank (ECB) in Europe, play a crucial role in managing inflation. Their primary tool is adjusting interest rates. When inflation is high, central banks may increase interest rates, making borrowing more expensive. This action can slow down spending and investment, reducing the demand for goods and services, and eventually, slowing down inflation.

Inflation and Exchange Rates: EUR to USD Example

Exchange rates are affected by inflation. When a country experiences higher inflation compared to others, its currency value tends to decrease relative to other currencies. Let’s consider the Euro (EUR) and the U.S. Dollar (USD). If inflation in the Eurozone is higher than in the U.S., the value of the Euro may decrease compared to the Dollar. This change means that it will take more Euros to buy the same amount of U.S. Dollars. Conversely, if inflation is higher in the U.S., the Dollar might weaken against the Euro.


The Interrelation

  • Scenario 1: Country A has higher inflation than Country B. As a result, Country A’s currency is likely to depreciate against Country B’s currency.
  • Scenario 2: To combat high inflation, Country A’s central bank raises interest rates. This makes borrowing more expensive, potentially slowing economic activity and reducing inflation.
  • Scenario 3: The higher interest rates in Country A now make it more attractive to foreign investors. They exchange their currency for Country A’s currency to invest there, increasing the demand for Country A’s currency and causing it to appreciate.


Example: EUR and USD

Consider the Euro (EUR) and the U.S. Dollar (USD). If the Eurozone has higher inflation than the U.S., the Euro may weaken against the Dollar. If the European Central Bank raises interest rates to combat this inflation, it might initially attract investment into the Eurozone, strengthening the Euro. However, this could also slow down the Eurozone’s economy, which in turn might impact the Euro’s strength.

Understanding these dynamics is key to grasping international finance and economics. The interplay between inflation, interest rates, and exchange rates is a delicate balance that central banks navigate to maintain economic stability.


In summary, inflation is a complex economic phenomenon that impacts consumers, central banks, and international currency markets. Understanding its dynamics, especially in the context of major currencies like the Euro and the U.S. Dollar, is essential in today’s interconnected global economy.


Trading Santa Rally

Bad Santa Rally

Hello, Investors!

As the festive season approaches, there’s a phenomenon in the stock market that often catches the eye of traders and analysts alike – the “Bad Santa” Christmas stock market rally. But what exactly is this phenomenon, and why does it matter to investors like you? Let’s dive in.

What is the “Bad Santa” Rally?

Traditionally, the stock market experiences a ‘Santa Claus Rally’ during the last week of December and the first couple of trading days in January. This is typically a period of increased stock prices, attributed to holiday cheer, tax considerations, and institutional investors settling their books.

However, there are years when this expected rally turns into what’s colloquially known as a “Bad Santa” rally. This refers to a scenario where, contrary to expectations, the market experiences a downturn or increased volatility during these festive days.

Causes of a “Bad Santa” Rally

Several factors can contribute to a “Bad Santa” rally:

1. Economic Indicators: Negative economic data or forecasts can dampen investor sentiment, leading to sell-offs.

2. Geopolitical Tensions: Global uncertainties or political instability can make investors cautious, impacting markets.

3. End-of-Year Portfolio Adjustments: Sometimes, institutional investors might rebalance or adjust portfolios for tax purposes, leading to unexpected market movements.

4. Low Trading Volumes: With many investors on holiday, lower trading volumes can lead to increased volatility.


How Should Investors Respond?

If you find yourself in the middle of a “Bad Santa” rally, here are a few tips:

– Stay Calm: Market fluctuations are normal. Avoid making hasty decisions based on short-term movements.

– Review Your Strategy: Ensure your investment strategy aligns with your long-term goals and risk tolerance.

– Opportunity to Buy: Sometimes, a downturn can present buying opportunities for undervalued stocks.

– Stay Informed: Keep an eye on market news and trends to make informed decisions.


Conclusion

While the “Bad Santa” rally might sound ominous, it’s just another aspect of the ever-dynamic stock market. Understanding these trends helps in making informed investment decisions and maintaining a healthy portfolio.

Here’s to making smart moves this holiday season and beyond!