What Is Liquidity

What is Liquidity?

Liquidity is the ability of an asset or security to be quickly converted into cash or cash equivalents without the asset or security losing too much market value. Liquidity is important for business and individual investors who, by their nature, need to sell investments and convert them to cash, often quickly. Liquidity is a key factor for businesses as it ensures that investments can be converted into cash quickly to pay for operating costs. Liquidity also allows businesses to take advantage of opportunities as they arise.

Liquidity also refers to the number of funds available in the market generally. The greater the available funds, the more liquidity there is. For example, during periods of high economic growth and low unemployment, there is typically greater liquidity in the market. Conversely, during times of recession and high unemployment, there is less liquidity in the market.

Why is Liquidity Important?

Liquidity is essential in the financial markets as it provides a more efficient market for investors to transact in, allows investors to take advantage of market opportunities, and provides access to capital for businesses. Without liquidity, the financial markets would be unable to function properly and investors would be unable to make profits or access capital. 

Investors must understand the importance of liquidity in the financial markets and must be aware of the risks associated with low liquidity. Knowing the importance of liquidity and how it affects the financial markets is an important skill for any investor.

Keep learning more with Eurotrader

Click the link below to get acquainted with our fund manager features with advantages such as high-quality liquidity, smooth onboarding, and broad market access!

What are the Liquidity Types?

Liquidity may be classified into three distinct types: market liquidity, funding liquidity, and accounting liquidity.

Market liquidity, also known as asset liquidity, refers to the ability of a market to convert a financial asset or financial instrument into cash quickly and at a price that reflects the true market value. This is an important feature of markets because it allows investors to easily enter and exit the market without affecting the price of the instrument due to a lack of buyers or sellers.

Funding liquidity, also known as financial liquidity, refers to the ability of a company to meet its short-term liabilities, such as payroll and interest payments, while having enough assets to pay its long-term liabilities, such as bondholders. In other words, the amount of cash available to the business is measured by its level of funding liquidity.

Accounting liquidity, also known as operational liquidity, measures how quickly a company can convert its assets into cash. This is done by measuring the current ratio, which is the ratio of current assets to current liabilities. A higher current ratio indicates that the company can liquidate its assets more quickly to pay off its short-term debts. The higher the current ratio, the more liquid the company is considered to be. 

What are the Examples of Liquidity?

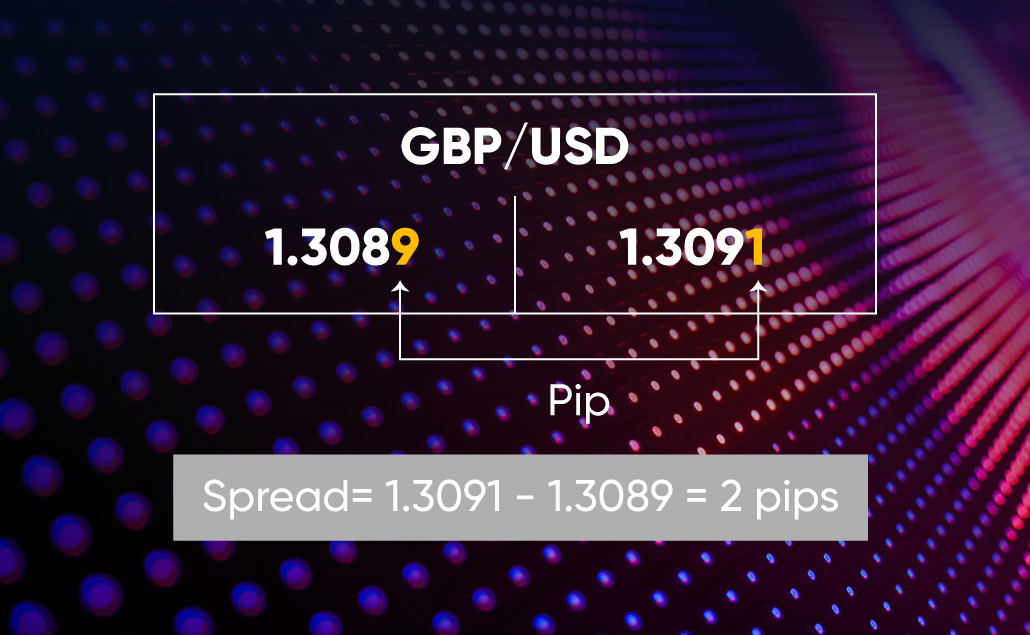
One example of high liquidity in the financial markets is in the equities markets. Investors can buy and sell stocks rapidly on major exchanges, typically with tight bid-ask spreads. Financial institutions can also increase liquidity by providing their liquidity to the market.

Bonds are another example of a liquid asset. If governments and corporations can issue debt securities with relative ease and at a reasonable cost, it indicates high liquidity in the bond markets. Credit default swaps, which are financial derivatives linked to the debt of certain entities, are also liquid and can be used to hedge against or speculate on the performance of a particular bond.

Commodities such as gold, silver, and oil are also typically liquid. These commodities are traded on multiple exchanges and their prices are often quoted throughout the day.

How to Calculate Liquidity?

Calculating liquidity can be done through the quick and current ratio formulas. The quick ratio formula is calculated by taking total current assets minus inventory and dividing it by total current liabilities. The current ratio formula is calculated by taking total current assets divided by total current liabilities. Both formulas are used to determine a company’s liquidity in comparison to its current liabilities.

The quick ratio formula can be calculated by taking the company’s total current assets and subtracting its inventory from that total. The result of this equation is divided by the company’s total current liabilities. This formula can be expressed as:

(Total Current Assets – Inventory) / Total Current Liabilities

The current ratio formula is calculated by taking the company’s total current assets and dividing it by the company’s total current liabilities. This formula can be expressed as:

Total Current Assets / Total Current Liabilities

At Eurotrader, we’re passionate about helping our members become successful traders. We provide an array of resources and support that make trading easier and more profitable. With our guidance, you can increase your return on investment and optimize your trading strategies. Join the Eurotrader community and start trading today to take your financial goals to the next level.

Disclaimer

Eurotrader doesn’t represent that the material provided here is accurate, current, or complete, and therefore shouldn’t be relied upon as such. The information provided here, whether from a third party or not, isn’t to be considered as a recommendation; or an offer to buy or sell; or the solicitation of an offer to buy or sell any security, financial product, or instrument; or to participate in any particular trading strategy. We advise any readers of this content to seek their advice.

What is a Stop-Sell Limit?

What is a Stop-Sell Limit?

Stop-sell limits are a type of order placed with a broker or other financial institution that instructs them to liquidate a position when it hits a certain value. This type of order is used to protect investors from large losses or to lock in profits while they are still in their positions. When a stop-sell limit is triggered, the position is sold at the predetermined price, even if it is lower than the current market price.

Stop-sell limits are also referred to as stop limits because the order is executed only when the security reaches the predetermined stop price. If the price of a security falls below the stop price, the order is activated, which allows investors to control losses to a certain extent, and to protect their gains if the price of a security increases.

When selecting a stop-sell limit, investors must decide how conservative or aggressive they would like to be in their trading strategy. The level of risk they are willing to take should always be taken into consideration before placing this type of order. For example, if an investor is willing to take on more risk, they would select a smaller stop-sell limit and a larger profit-taking limit. This could result in a larger gain if the price of the security increases, but also a larger loss if it falls below the stop price.

What is an example of a Stop-Sell Limit? 

To give a clear and abstract example of stop-sell limits in trading, let’s say an investor bought 10 shares of Company ABC stock at $10.00 per share and set a stop-sell limit of $9.50. This means that if the market drops below $9.50, the 10 shares of Company ABC stock will automatically be sold and the investor will limit losses. Additionally, if the market goes up, the investor could also set a profit-taking limit of, for example, $11.00. If the market reaches this level, the 10 shares of Company ABC stock will automatically be sold and the investor can take their profits.

Related Topics | Keep learning more with Eurotrader

Check out our video resources below for more information on how to use Buy-Stop and Stop-Sell and much more on the basics of trading!

Bid and Ask Prices

What is the Difference Between Sell-Stop and Sell-Limit?

A sell-stop and a sell-limit order are both types of orders used in a trading environment that are based on the price of a security. When it comes to Sell-Stop and Sell-Limit orders in trading, there are several distinct differences between the two.

  • The main difference between the two orders is the price at which the trade is executed. With a sell-stop order, the trade is executed at a lower price, and with a sell-limit order, the trade is executed at a higher price.
  • A sell-stop order can be triggered even if the security drops for a short time while a  sell-limit order can only be triggered if the security price rises and remains at or above the specified price for an extended period of time.
  • A sell-stop order may be executed at the specified price or a slightly lower price depending on market conditions. With a sell-limit order, the order is usually executed at the specified price or slightly higher depending on market conditions.

At Eurotrader, we’re passionate about helping our members become successful traders. We provide an array of resources and support that make trading easier and more profitable. With our guidance, you can increase your return on investment and optimize your trading strategies. Join the Eurotrader community and start trading today to take your financial goals to the next level.

Disclaimer

Eurotrader doesn’t represent that the material provided here is accurate, current, or complete, and therefore shouldn’t be relied upon as such. The information provided here, whether from a third party or not, isn’t to be considered as a recommendation; or an offer to buy or sell; or the solicitation of an offer to buy or sell any security, financial product, or instrument; or to participate in any particular trading strategy. We advise any readers of this content to seek their advice.

blue chip stocks

What are Blue-Chip Stocks?

Investing can seem intimidating for many beginners, but the principles of smart investing can help the average person build an impressive portfolio. Blue-chip stocks are a great way to build a foundation for your investments.

This article will explore the definition and benefits of blue-chip stocks, allowing investors to make well-informed decisions about their portfolios.

How Can You Understand that a Stock is a Blue Chip Stock?

Blue-chip stocks represent the safest, most established investments in the market, and they offer attractive returns. But how can you determine whether a stock is a blue chip?

First and foremost, blue-chip stocks are typically the most well-known and established businesses in the stock market. These are typically large companies that have been around for many years and have a very good track record of sound financial performance. Companies such as Apple, Microsoft, Coca-Cola, and Walmart are all examples of blue-chip stocks

Aside from the financials of the company, blue-chip stocks are also defined by their longevity and stability. They are the type of companies that have managed to maintain their market position despite market volatility and economic downturns

Another factor to consider when determining whether a stock is a blue chip or not is the dividend yield. Blue-chip stocks tend to pay high dividends and tend to remain consistent with those payments, making them a safe and reliable source of income

Finally, you should also look at the stock’s beta, which measures its volatility relative to the market. Blue-chip stocks usually have a beta below 1, meaning they are less volatile than the overall market. This is a sign of stability and key criterion for determining whether or not a stock qualifies as a blue chip.

Why Should You Invest in Blue Chip Stocks?

Blue chip stocks are some of the most reliable investments available. As a general rule, blue chip stocks tend to pay higher dividends, which can generate a steady stream of income for investors. They often have lower volatility and consistent stock price performance, making them less risky than other investments. 

Additionally, blue chip stocks are typically associated with heavily established and well-known companies that have stood the test of time and offer a degree of safety compared to other stocks on the market.

What are the Risks of Blue Chips Stocks?

The risks of blue chip stocks are as follows:

  • Risk of Overpricing: Blue chip stocks are usually priced higher than other stocks, making them more susceptible to market fluctuations and possibly overpriced.
  • Low Dividend Payouts: Because blue chips usually trade at higher prices, they typically have lower dividend payouts, making them a less attractive investment for income investors.
  • Lower Returns: Because of the higher prices, blue chips have a higher chance of underperforming the market and providing lower returns than other stocks.
  • Difficulty Selling: Blue chips can be harder to sell due to their higher price and lower liquidity. This can be a problem if you need to liquidate your position quickly.
  • Exposure to Broader Market: Blue chips are generally more correlated with the broader market than other stocks. This means they will be more impacted by large market swings than other stocks.

What are the Benefits of Blue Chips Stocks?

The benefits of blue chip stocks are:

  • Strong Dividend Yields: Blue chip stocks have a history of paying strong dividend yields, which can provide investors with a significant source of passive income.
  • Stability: Blue chip stocks have a track record of being stable investments. Their long-term success is often reflected in these stocks’ share prices, which tend to have less volatility than other stocks.
  • Low Risk: Blue chip stocks tend to be less risky investments than other stocks as they are often backed by established companies that are better able to manage any downturns in the market.
  • High Liquidity: Blue chip stocks tend to be highly liquid assets, meaning they can be bought or sold easily. This can make them attractive to investors who are seeking to liquidate assets quickly
  • Value Appreciation Potential: Despite their stability, blue chip stocks can still offer investors the potential for capital gains through long-term value appreciation.

What are The Top Blue Chip Stocks Examples?

Some of the most well-known companies offering blue chip stocks are as follows:

  • Apple Inc. – American multinational technology company that designs, develops, and sells consumer electronics, computer software, and online services.
  • Microsoft Corporation – American technology company that develops, manufactures, licenses, supports and sells computer software, consumer electronics, and related services.
  • Amazon.com – American multinational technology company that focuses on e-commerce, cloud computing, digital streaming, and artificial intelligence.
  • Alphabet Inc. – American multinational conglomerate founded in 2015 as a holding company for Google and its subsidiaries.
  • Exxon Mobil Corporation – American multinational oil and gas corporation that operates in most countries around the world and is the world’s largest company in terms of revenue

Chevron Corporation – American multinational energy corporation that specializes in oil, natural gas, and geothermal energy production and sales.

Volume in Stock

What is Volume in Stocks?

Volume is a term that is used a lot when it comes to investing, but what does it mean for traders? It is an indicator of how many shares of a stock are being bought and sold in a given time period. Anytime a share of a stock is bought, it also must be sold by a seller as there are a finite number of physical shares. In terms of CFD trading, volume is a reference to how many contracts are bought and sold since no physical shares are held by any buyer or seller. In this way, CFD trading volume numbers are not always representative of how the underlying stock is trading. 

Volume is related to price movements and liquidity for physical stocks. When trading volume is low, the stock is less liquid and price movements tend to be less volatile. The opposite is true when trading volume is higher. Daily average trading volume is often used in technical analysis and can be used to tell us how significant a market move is for that underlying asset and where potential entry and exit points are optimal. 

Stock Volume Example

Volumes in stocks are quite simple to use in analyzing physical stocks since you can easily compare trading volume from session to session. You can even take an average daily trading volume from each day over a given period of time like the past 30 days. Let’s say a stock has a daily average trading volume of 50 million shares. During yesterday’s session, that stock gained 10% and saw a daily trading volume of 80 million shares. We can deduce that the higher trading volume was bullish as the stock gained 10%, and that investors were buying shares, perhaps from an announcement from the company. 

In CFD trading, volume is calculated in very much the same way except it is the number of CFD contracts that changes hands not physical shares. The CFD contracts are not included in the daily trading volume of the stock, as CFD trading speculates on the price difference from an entry and exit position, rather than the actual stock price movement. 

What Can you Understand from Volume?

Volume is an excellent indicator of market interest in that particular stock. For example, during the short squeeze of meme stocks like GameStop (NYSE:GME) and AMC (NYSE:AMC), we saw record levels of daily average trading volume. An incredibly large amount of shares were changing hands throughout those sessions, which is why we witnessed such large gains and drops in those stock prices. 

In technical analysis, stocks volumes are a great way to know at what price levels people are holding shares at. This is often called a volume shelf on technical analysis charts, and can indicate upcoming volatility. If a stock sees high volume until it hits $100.00 per share and then the volume drops off, we can assume that there are a lot of people holding the stock at that $100.00 price level. If the stock price falls, we know the volume will once again pick up if the stock goes back to $100.00 since those people will most likely be holding their shares and waiting for the price to return. 

What Can’t you Understand from Volume?

Volume is a past performance indicator and is generally not indicative of what will happen in the future aside from the volume shelves mentioned in the previous section. In CFD trading, contract volume can tell us how many contracts are traded, but it doesn’t illustrate how many traders are actually interested in the stock. For example, if 500 CFDs change hands, we don’t know if it was five traders trading 100 CFDs or one trader trading 500 CFDs. Since the price of the CFD does not rise or fall like the underlying stock price does, it’s not a great indicator of how interested the market is in that stock. 

How to Calculate Volume?

Trading volume is quite simple to calculate as it is quite literally just the number of physical shares that changed hands over a specified period. Volume is usually calculated per day and then per short-term period like 30-days to get the average per session. For CFDs, it is the total number of CFDs that are bought or sold on that day. One CFD contract is equal to one physical share, so once again it is quite simple to calculate CFD trading volume. 

What is a Volume Chart?

Volume charts are exactly as they sound: charts that give us a visual of trading volume for a particular asset. A volume price trend indicator chart or VPT is often used in technical analysis as a comparison of how the stock’s price moved given the different levels of daily trading volume. These are used by traders to determine exit and entry points, as well as charting areas of support and resistance. 

What are the Indicators of Volume?

There are several indications of high trading volumes for a stock. The single best giveaway that a stock is experiencing higher than average trading volume is that the stock is making a large price move in one direction or the other. When trading CFDs, you may notice the price fluctuations in the underlying asset, which will have a direct effect on your potential profit or loss. Using volume in technical analysis can give CFD traders an idea of at what levels large price movements will happen again, and when there may be some consolidation. 

Disclaimer

Eurotrader doesn’t represent that the material provided here is accurate, current or complete, and therefore shouldn’t be relied upon as such. The information provided here, whether from a third party or not, isn’t to be considered as a recommendation; or an offer to buy or sell; or the solicitation of an offer to buy or sell any security, financial product or instrument; or to participate in any particular trading strategy. We advise any readers of this content to seek their own advice.

Fractional Share

What is a Fractional Share?

Fractions are an important part of math but have you ever wondered what a fractional share is? You may have come across this phrase but do not know what it means. 

A fractional share is a unit of ownership of a company that is less than one full share, and this article will explain how fractional shares work and how they are used in the financial world.

What is a Fractional Share in Stocks?

Fractional shares are a type of investment in which the investor purchases partial shares of a stock or other security. 

For example, if a publicly traded company were trading at $100 per share, an investor may purchase a fractional share for $50 instead of one full share. Fractional shares can be a useful way for investors with limited funds to still participate in the stock market.

Fractional Share Example

An investor may purchase 1/10th of a share for $10 with the share currently trading at $100. This gives the investor ownership of .1% of the company, but at a much lower cost than if they had purchased a full share. Fractional shares are becoming increasingly popular with the rise of fractional trading apps, like Robinhood, which allow investors to buy portions of stocks.

What are the Advantages and Disadvantages of Fractional Shares?

The advantages of fractional shares are as follows:

  • Being more affordable: Fractional shares allow investors to purchase a part of a whole share. This means that investors with smaller budgets can benefit from the same ownership in stock as those with larger budgets.
  • Diversification: Diversifying your portfolio is essential for good investment management, but it can be hard to do when you have a limited budget. With fractional shares, you can afford to have a diverse portfolio.
  • Low Impact Investing: Much of the anxiety and risk associated with traditional investing can be reduced by the purchase of fractional shares. This is due to the fact that fractional investments are much smaller and have a much lower associated level of risk.

The disadvantages of fractional shares are:

  • Liquidity: Liquidity is a major concern when investing in fractional shares, as the assets are not as liquid as a full share. This means that it may be difficult to sell or trade your fractional shares quickly should you need to do so.
  • Lack of Voting Rights: As the investor only owns a fraction of the stock, they are unable to exercise full voting rights on the stock. This means that they are limited in their ability to influence the company’s direction.
  • Higher Brokerage Fees: Investors may need to pay higher brokerage fees due to the smaller size of their fractional share purchases. This could make the investment less affordable and reduce potential returns.

How to Buy and Sell Fractional Shares of CFDs?

Fractional shares of Contracts for Difference (CFDs) are traded just like other types of financial instruments. The process begins by selecting a broker and then opening an account with them. Once the account is opened and funded, investors can place orders just like they would any other type of security

Many CFD brokers offer access to an online trading platform, allowing traders to buy and sell CFDs in the comfort of their own homes. Traders will need to research which CFDs to buy, as each one is different, and understanding the risks associated with each one is a must before executing any trades

When it comes to buying and selling fractional shares of CFDs, investors should first look for the best possible price and take advantage of any available discounts. It is also important to consider the commission fees, which can vary between brokers, as well as any other trading fees associated with the CFDs

Finally, once an investor has selected the CFD they want to buy or sell, they can then place the orders either online, through a broker’s telephone service, or through the broker’s office.

 Investors should also keep a close eye on the markets and adjust their trades accordingly to suit any changes in the value of the CFDs.

Bull and Bear Market

What are Bull And Bear Markets?

Investing in the stock market can be a confusing endeavor, with many different terms and concepts to understand. One of the most important concepts to understand is the difference between bull and bear markets. 

A bull market is when stock prices are rising and a bear market is when prices are falling. 

In this article, we will discuss the definition of and differences between bull and bear markets, and what investors can do to stay informed and make the most of their investment decisions.

Bull and Bear Market Examples

Both bull and bear markets have appeared throughout the history of economics.

One example of a bull market would be the stock market in the United States during the 1990s and early 2000s. During this time period, the S&P 500 rose from a low of 400 in 1994 to a high of 1,500 in 2000. Investors made large profits during this time period as the market surged and many tech stocks gained immense popularity.

One example of a bear market would be the stock market in the United States during the 2008 financial crisis. During this time period, the S&P 500 fell from a high of 1,500 in October 2007 to a low of 676 in March 2009. Investors saw large losses during this time period as the market crashed and many stocks lost most of their value.

What is the difference? Bullish vs. Bearish Markets

A bullish market is a market that is on the rise. It is characterized by optimism and a belief that prices of stocks, bonds, assets, and other investments will continue to rise. Investors in a bullish market are typically confident in the future economic outlook and bullish on the prospects of the stock market.

A bearish market is a market that is on the decline. It is characterized by pessimism and a belief that prices of stocks, bonds, assets, and other investments will continue to decrease. Investors are typically fearful of the future economic outlook and bearish on the prospects of the stock market.

History: Why are They Called Bull and Bear Markets?

The terms “bull” and “bear” market comes from the way the animals attack their opponents. A bull thrusts its horns up into the air, while a bear swipes its paws downward. In the stock market, bull markets are trends of rising prices, and bear markets are trends of falling prices.

Margin Trading

What is Margin in Trading?

Margin in trading refers to the practice of utilizing leverage to increase the potential returns from the purchase and sale of securities. In simple terms, it is the borrowing of money from a broker to purchase securities. This practice can help traders increase their buying power, allowing them to make bigger trades than what their actual funds would allow. 

In this article, we’ll take a closer look at what margin in trading is and how it works.

What does Buying on Margin Mean?

Buying on margin is a type of investment strategy that involves purchasing an asset, such as stocks, using borrowed funds provided by a broker. The borrower receives a loan from the broker, typically in the form of cash, and uses it to purchase the asset. The borrower will then pay back the loan plus interest, using the proceeds from any future sale of the asset. 

This type of investment technique is generally considered to be riskier than investing with cash.

How Do You Buy CFDs on Margin?

CFDs are derivatives products that are traded on margin. They allow traders to open a position based on the exact amount of money a trader is willing to risk (the margin). 

To buy CFDs on margin, first, you need to open an account with a CFD broker. Next, you’ll need to select the CFD you wish to trade, and then decide how much leverage you would like to use. Different brokers allow for different amounts of leverage, so it’s important to check their leverage policy before deciding how much risk you would like to take. With a CFD broker, you can then place an order and the broker will execute the purchase at the market price. 

Once the trade is complete, your account will be credited with the difference between the purchase and sell prices.

What is a Margin Call?

A margin call is a broker’s demand for an investor who has purchased securities on margin to deposit additional funds in order to bring the margin account up to the minimum maintenance margin requirement. It is a warning that the investor’s equity in the account is falling below a certain level, and if it continues to decline, the broker may need to liquidate the investor’s holdings to cover the margin loan.

What Is Free Margin?

Free margin is the amount of money in your trading account that is available to open new positions. It is the difference between the equity in your trading account and the margin that is used to maintain open positions. It can be used as a tool to measure the risk level of a position.

The Risks and Benefits of Buying on Margin

The risks of buying on margin are as follows:

  • Margin Calls: A margin call occurs when the value of a margin account falls below the margin maintenance requirement set by the broker. If this happens, the trader must deposit more money or securities in order to meet this requirement or face the risk of their position being liquidated.
  • Unforeseen Price Action: Margin trading carries the risk of unforeseen price action that can cause higher losses than what the trader initially predicted. This can occur if the trader’s position moves against them and they are unable to close it in time before a large decrease in the market value.
  • Liquidation Risk: If a trader’s account runs out of money or the market prices move against the trader, their positions may be liquidated. This means their broker will close out the trades and the trader is liable for any losses and fees associated with the liquidation
  • Leverage Risk: Leverage can be both a benefit and a risk. When the market moves in a favorable direction, leveraging can allow a trader to make higher profits than if they simply invested the same amount of money without leverage. On the other hand, when the market moves in an unfavorable direction, leveraging can magnify losses and leave the trader in a negative position

While the benefits are:

  • Increased Potential Profits: By leveraging their capital, margin traders can increase their potential profits. Leveraging allows traders to invest more money than they normally would be able to while using only their own capital. This can end up increasing their profits significantly
  • Lower Transaction Costs: Since the money used to make trades is effectively borrowed, the transaction costs are generally much lower on a margin account than on a regular trading account. This means traders can make more transactions with less capital, potentially increasing their profit
  • Easy Access to Capital: Margin accounts provide traders with easy access to capital, which can be used to fund more trades or to increase their trading size on existing positions. This can be beneficial to traders who don’t have a lot of capital to start with, but still want to trade.
Stop Loss Order Forex

What Is a Stop Loss Order?

A stop-loss order is an order to buy or sell a security when it reaches a certain price point. A stop-loss order helps investors to protect their capital and limit their losses, while also allowing them to remain in trade without having to monitor the market throughout the day. When a stop-loss is triggered, the security is sold automatically and the investor’s losses are limited.

Stop-loss orders can be used as part of a wider strategy. By setting multiple stop-loss orders, investors can ensure that they are exiting trades at pre-determined price points and reducing their potential losses. 

Additionally, investors can use stop-loss orders as part of a trend-following strategy, where trades are closed out at the end of a trend.

How Does a Stop Loss Order Work?

The stop-loss order helps traders and investors manage risk in their portfolios. When the security reaches the specified price, the broker will close the trade, realizing a loss. This type of order is especially useful when trading volatile markets where prices can drop suddenly and unexpectedly. 

Stop-loss orders allow traders to limit the amount of risk they are willing to take on, allowing them to sleep better at night. Stop-loss orders are a common risk-management tool used by traders and investors alike.

Keep learning more with Eurotrader

Profit and loss ratios are very important in trading. You can access the link below, which we have prepared for you, and where you can make profit and loss calculations down to the most detailed detail!

Eurotrader Education Hub

Why Do You Use a Stop Loss Order?

When it comes to investing, risk management is a key part of preserving and growing wealth. One way that investors guard against potential losses is with a Stop Loss order. 

Stop Loss orders are designed to limit any losses on a particular investment by automatically selling the asset, such as a stock, at a certain price. This predetermined price point is set based on the investor’s risk tolerance as well as their desired level of return. By using a Stop Loss order, investors are protected from excessively large losses due to market downturns or other unpredictable events. 

The order also takes a lot of the emotion out of trading, as the investor does not have to manually sell the stock – it is done automatically. Therefore, Stop Loss orders can prove to be a valuable tool for investors who are looking to limit their losses and achieve their desired return on investment.

How Long Can Your Stop Loss Orders Last?

Stop loss orders are instructions placed with a broker to sell a security when it reaches a certain price point. This way, if the security plummets, the investor doesn’t take a huge hit. Stop loss orders can be set to last for as long as the investor wants; it can be a day, a week, a month, or even a year. However, due to market fluctuations, the order may be triggered before the time is up. It is important to monitor stop-loss orders and adjust them accordingly if they don’t match the investor’s current goals. 

Also, investors can choose to close out their order at any time if they don’t want it to run any longer. The investor can also set price adjustments on a stop-loss order should the market move in their favor. All in all, it is important to consider how long a stop-loss order should be set to ensure it is serving its purpose in the portfolio.

At Eurotrader, we’re passionate about helping our members become successful traders. We provide an array of resources and support that make trading easier and more profitable. With our guidance, you can increase your return on investment and optimize your trading strategies. Join the Eurotrader community and start trading today to take your financial goals to the next level.

Disclaimer

Eurotrader doesn’t represent that the material provided here is accurate, current, or complete, and therefore shouldn’t be relied upon as such. The information provided here, whether from a third party or not, isn’t to be considered as a recommendation; or an offer to buy or sell; or the solicitation of an offer to buy or sell any security, financial product, or instrument; or to participate in any particular trading strategy. We advise any readers of this content to seek their advice.

Fundamental Analysis

What is Fundamental Analysis?

Fundamental Analysis is an investment strategy used to assess companies and industries by analyzing their financial data, including income statements and balance sheets. This technique examines the intrinsic value of an investment item by taking a close look at its financials, such as performance, strengths, and weaknesses. 

The main goal of this approach is to determine whether or not a given stock is undervalued or overvalued by the market. To do this, investors use financial reports and financial ratios to compare companies and identify the best investment opportunities.

By assessing the current financial state of a company, fundamental analysis can help investors discover potential opportunities that may have gone unnoticed. For instance, an analysis may reveal that a given stock is trading at a lower than its intrinsic value, meaning the stock could be a good buy. Furthermore, this technique can also be used to identify which stocks to sell if their market prices are higher than the intrinsic value.

What is an Example of Fundamental Analysis?

A good example is when analyzing Walmart (NYSE: WMT), an investor would look at the company’s financial statements, including the balance sheet, income statement, and cash flow statement. By studying the company’s financial statements, the investor can get an idea of the company’s financial performance and current condition. 

Additionally, an investor can look at the company’s financial ratios, such as the price-earnings ratio or the debt-to-equity ratio, to get a better understanding of the company’s fundamentals. Furthermore, the investor can analyze the company’s competitive positioning, management team, and business model to gain insight into the company’s potential prospects. 

Lastly, analyzing elements such as the company’s dividend history and stock price performance can also be useful for fundamental analysis. 

Keep learning more with Eurotrader

While we have covered everything about fundamental Analysis in this article, there is still a lot to learn about trading! Click on the link below to watch our videos where you can learn all the details about trading!

Trading Video Courses

What are the Advantages And Disadvantages of Fundamental Analysis?

Fundamental analysis is a method of evaluating a stock or other asset by analyzing its intrinsic value and underlying economic, financial, and business fundamentals. While it can be a helpful tool in making investment decisions, it also has both advantages and disadvantages that must be considered.

Advantages of Fundamental Analysis

  • The fundamental analysis offers a long-term view of investing, by looking at economic, financial, and business conditions over time.
  • It allows investors to understand the company’s overall financial health, and make informed decisions about investments.
  • For example, fundamental analysis can help identify companies with strong performance, or stocks that are undervalued.
  • It can also be used to forecast potential earnings and determine the fair value of a company based on its assets, liabilities, and prospects.

Disadvantages of Fundamental Analysis

  • Fundamental analysis is a lengthy and complex process that requires extensive research and analysis.
  • It can also be difficult to estimate the prospects of a company, so the results of the fundamental analysis should be taken with a grain of salt.
  • Fundamental analysis can also be subjective, as the interpretation of economic, financial, and business factors is subject to individual opinion and bias.
  • Additionally, the results of fundamental analysis can be quickly outdated due to changes 

What are Quantitative and Qualitative Fundamental Analyses?

Quantitative and fundamental analysis are two widely used methods of making investment decisions in the stock market. Quantitative analysis is a form of analysis where investors use data on stocks such as pricing, volume, and financial metrics to make decisions. Some of the most common quantitative metrics used in the fundamental analysis include the price-to-earnings (P/E) ratio, enterprise value to EBITDA, and revenue growth rate.

Qualitative fundamental analysis is a method of analysis that focuses on the qualitative aspects of a business such as its product offerings, leadership, competitive landscape, and prospects. Qualitative features such as management capabilities, company culture, and overall strategy are used in this type of analysis.

At Eurotrader, we’re passionate about helping our members become successful traders. We provide an array of resources and support that make trading easier and more profitable. With our guidance, you can increase your return on investment and optimize your trading strategies. Join the Eurotrader community and start trading today to take your financial goals to the next level.

Disclaimer

Eurotrader doesn’t represent that the material provided here is accurate, current, or complete, and therefore shouldn’t be relied upon as such. The information provided here, whether from a third party or not, isn’t to be considered as a recommendation; or an offer to buy or sell; or the solicitation of an offer to buy or sell any security, financial product, or instrument; or to participate in any particular trading strategy. We advise any readers of this content to seek their advice.

spread in forex

What is Spread in Forex?

The spread is the difference between the buying price (bid) and the selling price (ask) of a currency pair. It is the cost of transacting a trade. The spread changes continuously depending on liquidity and market conditions and can range from a fraction of a pip to several pips. By understanding the spread, traders can capitalize on opportunities when they arise and know when the market is not worth entering.

It is important to understand exactly how the spread, a fundamental factor in the foreign exchange market, works. Spreads will vary depending on liquidity, volatility, and other market conditions. Generally, the more liquid a currency pair is, the narrower the spread will be, which means that the price difference between the bid and ask is smaller. Similarly, when volatility or market conditions pick up, spreads will generally widen, meaning the cost of trading goes up.

By understanding the spread, traders can identify when certain price movements or trends in the currency pair may be beneficial or costly. Knowing how much you can expect to pay in spread fees will help you determine which trades are the most beneficial to enter. Additionally, with the right strategies in place, traders can capitalize on opportunities when spreads narrow and avoid trades when spreads widen.

How to Calculate the Spread in Forex?

Spread in the Forex is typically measured in pips (1 pip = 0.0001) and is the broker’s commission for executing the trade. The formula for calculating the spread is:

Spread = Ask Price – Bid Price

For example, if the EUR/USD bid price is 1.3000 and the ask price is 1.3003, then the spread would be 3 pips (1.3003 – 1.3000 = 0.0003 = 3 pips).

What Determines the Spread in Forex?

The spread is determined by a variety of factors, but primarily by supply and demand. When a currency pair is in high demand, meaning many traders want to buy it, the bid price will be higher than the ask price and the spread will be larger. When demand is lower, the spread will be smaller. Spreads can also be affected by economic events, such as economic data releases, news events, and central bank decisions. Other factors affecting the spread include the liquidity of a currency pair, trading costs, and the broker’s markup. In some cases, a broker may add additional costs to the spread to make a profit. 

At Eurotrader, we’re passionate about helping our members become successful traders. We provide an array of resources and support that make trading easier and more profitable. With our guidance, you can increase your return on investment and optimize your trading strategies. Join the Eurotrader community and start trading today to take your financial goals to the next level. 

Disclaimer

Eurotrader doesn’t represent that the material provided here is accurate, current, or complete, and therefore shouldn’t be relied upon as such. The information provided here, whether from a third party or not, isn’t to be considered as a recommendation; or an offer to buy or sell; or the solicitation of an offer to buy or sell any security, financial product, or instrument; or to participate in any particular trading strategy. We advise any readers of this content to seek their advice.